Section 2.3 Learning and evaluation
Thresholds, errors and calibration
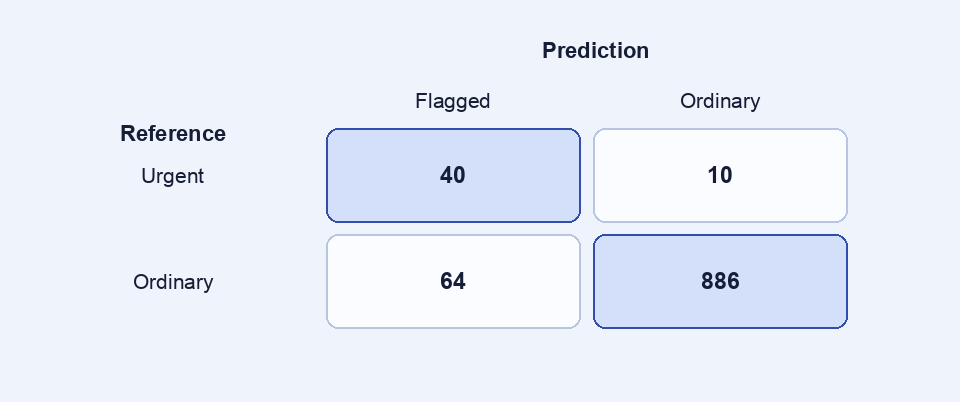
In a constructed set of 1,000 cases, 50 are urgent. A system that classifies every case as ordinary achieves 95% accuracy while detecting zero urgent cases. Choosing a threshold calls for reading all four cells of the confusion matrix.
| Policy | True positives | False positives | False negatives | True negatives |
|---|---|---|---|---|
| A, lower threshold | 40 | 64 | 10 | 886 |
| B, higher threshold | 30 | 20 | 20 | 930 |
Understand each denominator
For A, recall is 40/50 = 80%. Precision is 40/104 ≈ 38.5%. For B, both are 60%. Recall looks at cases known to be urgent. Precision looks at cases flagged by the system. If a missed urgent case costs eight units and an unnecessary review costs one, A costs 144 units and B costs 180 on this set. A capacity limit of 60 reviews would change the decision. The counts and costs are constructed to make the calculation inspectable.
Does a score of 0.8 really mean 80%?
A score can rank cases without providing a reliable probability. Calibration compares the observed event frequency within groups of scores to the stated probability. If roughly eight of ten requests scored near 0.8 are actually urgent, this group is consistent with calibration. A small group yields an uncertain estimate. Fit a calibration method on validation data kept separate from the test set, then check the effect of a change in the event’s base rate.