Section 5.4 Reliability and capstone
Trade off reliability, cost and latency
A larger model or longer context may improve certain answers and make the service more expensive. A useful comparison evaluates several dimensions on the same requests. Define response time from the reader’s perspective, the passage budget and the cost of requests a person must revisit.
Measure observable tradeoffs
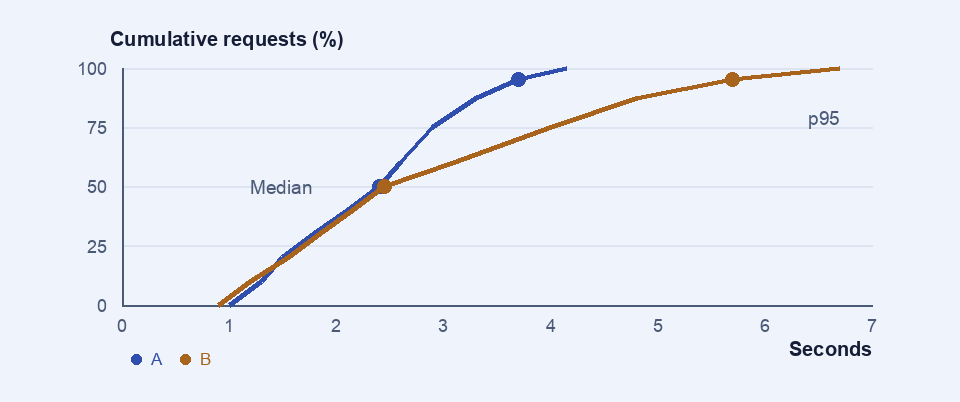
The median time describes a typical request under the observed protocol. The 95th percentile is a threshold below which roughly 95% of times fall, depending on the estimator. A mean does not reveal long requests that can make a system difficult to use. Recording retrieval, input processing and generation separately helps locate the delay. A service may return a passage promptly and prepare a synthesis once it has enough evidence.
Account for abstention
A policy that handles 60 out of 100 requests and answers 54 correctly has 90% accuracy on its answers and 60% coverage. Another handles 90 and gets 72 right, yielding 80% accuracy on its answers and 90% coverage. The two create different workloads for follow-up. Compare consequential errors, coverage and review capacity. In production, also record retries, incomplete replies and source failures.